Prior to 2019, July 2016 was Anchorage, Alaska's warmest month on record. Summer 2019 as a whole was even warmer than July 2016.
A warm synoptic pattern that occurred within the context of increased anthropogenic greenhouse gas forcing resulted in exceptional and persistent record-breaking warmth this summer. During June-August 2019, Anchorage experienced its warmest summer on record by 2.0°F (1.1°C). Its summer mean temperature (62.815°F/17.119°C) exceeded that of its warmest month on record prior to 2019 (62.694°F/17.052°C in July 2016).
Summer 2019 saw Anchorage record its warmest-ever June, July, and August. Anchorage tied its all-time record high minimum temperature on two consecutive days. Anchorage reached 90°F (32.2°C) for the first time on record. The duration of the excessive warmth and extreme temperatures recorded during the summer would have been very unlikely, if not improbable, without human-induced climate change.
PREDOMINANT SYNOPTIC PATTERN
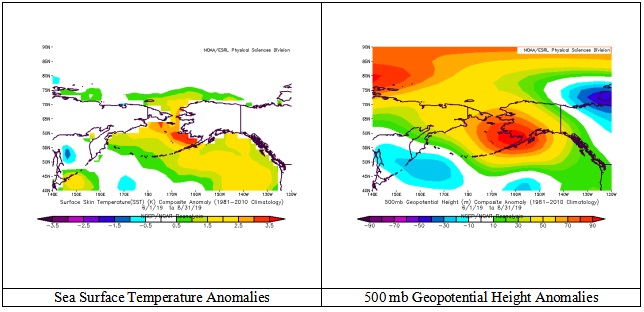
Summer 2019 featured a remarkable coupling of atmosphere and ocean. A persistent upper air ridge that promoted warm and dry conditions was anchored over the waters with the highest sea surface temperature anomalies.
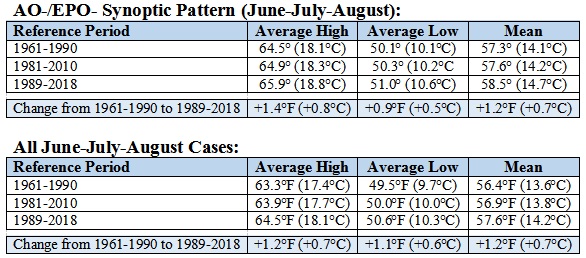
These conditions promoted a synoptic pattern where the East Pacific Oscillation (EPO) was negative. The negative EPO combined with a negative Arctic Oscillation (AO) to form a negative Arctic Oscillation-negative EPO pattern (AO-/EPO-) that predominated during the summer. During summer 2019, the AO was negative on 81/92 (88%) days. The EPO was negative on 60/92 (65%) of days.
An AO-/EPO- pattern is typically a warm one in Anchorage. For the current climate reference period (1981-2010), the average summer temperature in Anchorage was 56.9°F (13.8°C). During AO-/EPO- patterns, the average was 57.6°F (14.2°C). Climate change has led to summers becoming warmer and also warm synoptic patterns (AO-/EPO-) becoming warmer.
ROLE OF CLIMATE CHANGE
The observed global warming since the 1950s is unequivocal with anthropogenic greenhouse gas emissions being the dominant driver of that warming (IPCC Climate Change Synthesis Report 2014). The warming is a global phenomenon with 98% of the world having experienced its warmest 51 years during the current 2,000 years (Neukom, et al. 2019).
Since 1880, Arctic temperatures have been increasing at more than twice the rate of global temperatures (GISTEMP Data Set). In recent decades, the rate at which the Arctic has been warming relative to worldwide temperatures has increased. From 1980 through 2018, the Arctic has warmed at a decadal rate of 1.51°F (0.84°C), which is just over 3.5 times the global rate (GISTEMP Data Set). Multiple lines of evidence corroborate the rapid warming that is taking place in the Arctic. Increases in humidity, precipitation, river discharge, glacier equilibrium line altitude and land ice wastage; warming of near-surface permafrost; and, decreases in sea ice thickness and extent, and spring snow cover extent and duration are consistent with rising temperatures (Box, et al. 2019).
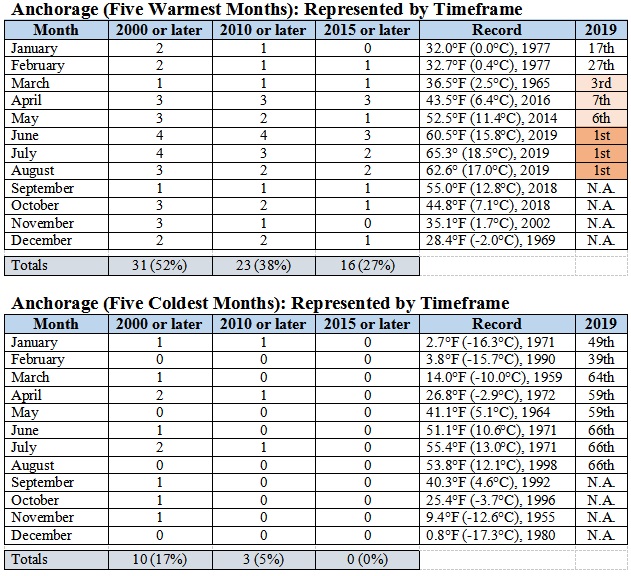
Consistent with the Arctic warming, Alaska has recently experienced temperatures that are warmer than they have been at any time in the past century (Thoman et al., 2019). As Alaska has warmed, Anchorage has also experienced rising temperatures. A disproportionate share of Anchorage's warmest months has occurred in 2000 or later.
During the 1961-1990 base period, Anchorage had a summer (June 1-August 31) mean temperature of 56.4°F (13.6°C). During the current climate reference period (1981-2010), Anchorage's average summer temperature had risen to 56.9°F (13.8°C). For the most recent 30-year period (1989-2018), Anchorage's average summer temperature had increased further to 57.6°F (14.2°C). The last time Anchorage had a cooler than normal summer (mean temperature below the 1981-2010 reference period) was 2012 when the average summer temperature was 56.0°F (13.3°C).
Without climate change, the extreme summer 2019 warmth would have been improbable. However, the combination of a rising average summer temperature and increasing variability (1961-1990: mean temperature 56.4°F/13.6°C; standard deviation: 1.4°F/0.8°C vs. 1989-2018: mean temperature: 57.6°F/14.2°C; standard deviation: 1.6°F/0.9°C) has made summers like 2019 approximately 190 times more likely than they had been.
The long duration of the AO-/EPO- synoptic pattern led to the relentless persistence of above to much above normal temperatures in Anchorage that allowed monthly warm temperature records to be set in June, July, and August. Rapid Arctic warming has contributed to an increasing frequency of long-duration upper air patterns (Francis, et al. 2018). Should the world warm 3.6°F (2.0°C) above its pre-industrial temperatures, the persistence of boreal summer weather will likely increase further (Pfleiderer, et al. 2019).
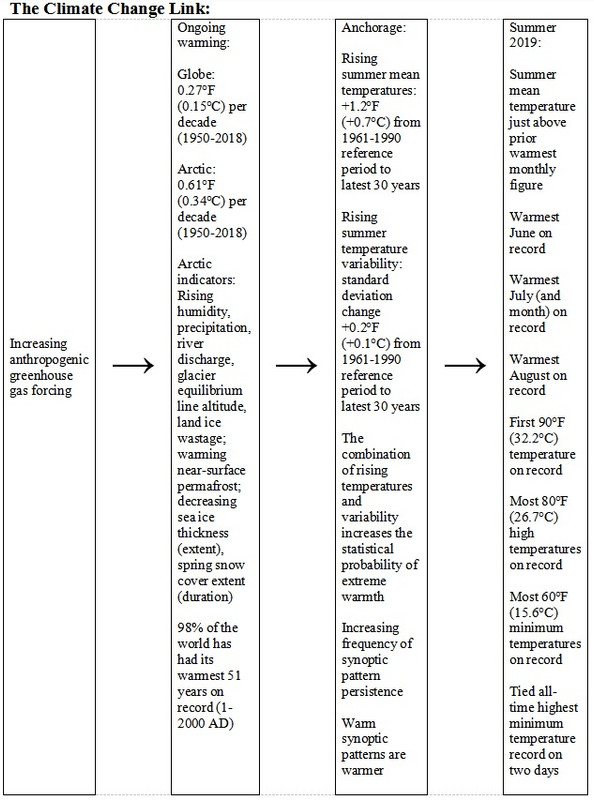
Based on the above evidence, human-driven climate change played a key role in bringing about Anchorage's historic summer warmth. Without anthropogenic warming, the combination of the exceptional heat and remarkable duration of the warmth in Anchorage would have been very unlikely, if not improbable.
DATA AND RECORDS

Summer 2019 Temperature Thresholds:
Lows 60°F (15.6°C) or above: 9 days (previous summer and annual record: 4, 2016)
Highs 70°F (21.1°C) or above: 49 days (previous summer record: 40, 2004; previous annual record: 42, 2013)
Highs: 80°F (26.7°C) or above: 8 days (previous summer and annual record: 4 days, 2015)
Highs: 90°F (32.2°C) or above: 1 day (none prior to 2019)
Daily Record High Minimum Temperatures:
June 8: 54°F (12.2°C) (old record: 53°F/11.7°C, 1978)
June 24: 58°F (14.4°C) (tied record set in 1984)
June 28: 57°F (13.9°C) (old record: 56°F/13.3°C, 2015 and 2016)
June 29: 60°F (15.6°C (old record: 58°F/14.4°C, 1984 and 1990)
June: 3 new records and 1 tied record
July 2: 57°F (13.9°C) (tied record set in 1970)
July 3: 58°F (14.4°C (tied record set in 1979 and tied in 1999 and 2014)
July 5: 61°F (16.1°C) (old record: 60°F/15.6°C, 1984)
July 6: 59°F (15.0°C) (tied record set in 2015)
July 8: 61°F (16.1°C) (old record: 59°F/15.0°C, 1968, 2003, and 2004)
July 9: 62°F (16.7°C) (old record: 59°F/15.0°C, 2003)
July 12: 60°F (15.6°C) (old record: 59°F/15.0°C, 1977)
July 13: 59°F (15.0°C) (tied record set in 1972 and tied in 2013)
July 20: 59°F (15.0°C) (old record: 58°F/14.4°C, 1973, 1983, 2003, 2004, and 2016)
July 22: 58°F (14.4°C) (tied record set in 1984 and tied in 1996, 2013, and 2016)
July 24: 59°F (15.0°C) (tied record set in 1984)
July: 5 new records and 6 tied records
August 7: 61°F (16.1°C) (old record: 58°F/14.4°C, 1979 and 1983)
August 13: 63°F (17.2°C) (old record: 57°F/13.9°C, 2003) ***tied all-time record***
August 14: 63°F (17.2°C) (old record: 58°F/14.4°C), 2001) ***tied all-time record***
August 16: 58°F (14.4°C) (tied record set in 1967)
August 17: 57°F (13.9°C) (old record: 56°F/13.3°C, 1984)
August: 4 new records and 1 tied record
Summer: 12 new records and 8 tied records
Daily Record High Maximum Temperatures:
June 23: 78°F (25.6°C) (old record: 75°F/23.9°C, 1974)
June 24: 75°F (23.9°C (old record: 74°F/23.3°C, 2015)
June 27: 79°F (26.1°C) (old record: 78°F/25.6°C, 1997)
June 28: 81°F (27.2°C) (old record: 80°F/26.7°C, 1997)
June 29: 82°F (27.8°C) (old record: 77°F/25.0°C 1968, 1989, and 1990)
June: 5 new records
July 3: 80°F (26.7°C) (tied record set in 2018)
July 4: 90°F (32.2°C) (old record: 77°F/25.0°C), 1999) ***all-time record***
July 5: 81°F (27.2°C) (old record: 77°F/25.0°C, 1999)
July 6: 81°F (27.2°C) (tied record set in 2015)
July 7: 85°F (29.4°C) (old record: 79°F/26.1°C, 2009)
July 8: 85°F (29.4°C) (old record: 84°/28.9°C, 2003)
July: 4 new records and 2 tied records
August 7: 77°F (25.0°C) (tied record set in 2015)
August 10: 77°F (25.0°C) (old record: 75°F/23.9°C, 1960, 1972, and 2004)
August 12: 77°F (25.0°C) (tied record set in 2005)
August 13: 77°F (25.0°C) (old record: 75°F/23.9°C, 1963, 1977, 2007)
August 14: 75°F (23.9°C) (old record: 74°F/23.3°C, 1990)
August 15: 77°F (25.0°C) (old record: 76°F/24.4°C, 1984)
August: 4 new records and 2 tied records
Summer: 13 new records and 4 tied records
CONCLUSION
Anchorage experienced a historically warm summer. The all-time record high temperature was established, the all-time record warm minimum temperature was tied on two consecutive days, and numerous daily record high maximum and minimum temperatures were set or tied. June 2019 was the warmest June on record. July 2019 was the warmest July and month on record. August 2019 was the warmest August on record.
Ocean-atmosphere coupling produced a persistent pattern associated with warmer than normal temperatures. Anthropogenic climate change, that has driven global and Arctic warming and led to increasing temperature variability in the Arctic region, has dramatically increased the probability of persistent warmth and extreme high temperatures. Absent the contribution of climate change, the kind of warmth seen during summer 2019 was extremely unlikely, if not improbable.
Going forward, the ongoing warming is likely to continue on account of a continuing rise in the atmospheric concentration of greenhouse gases. Although summer warmth equivalent to 2019 will likely remain rare over the next decade or two, the probability of such occurrences will very likely increase.
21 comments
William Sutherland said:
To minimize the mass-extinction event that many scientists say has already begun, it is imperative countries work together in a serious united effort to eliminate the human factor. However, for this to work there must be consistency. One cannot set one level of CO2 standards for first world developed countries and weaker CO2 standards for third world developing countries. Every nation is interconnected in some way (no - third world developing countries do not live in a vacuum such that their activities do not impact our planet) and thus must abide by the same standards without exception for any action plan to work.
Peggy C said:
Tongass National Forest, Alaska
Don Sutherland replied to Peggy C:
Stormlizard said:
In order to reduce the production of 'Greenhouse gases' our govenment decided to shut down all coal fired power stations and use Natures own energy 'Thesun and wind' to provide power, we did try a 'Pilot nuclea generator' but ended it because of the difficulties involved disposing of the 'Nuclear waste'.
Another thing that changed our temperatures in general was that the Gulf stream began moving westwards.
The Govenment descission was made when we struck oil and natural gas beneathe thesea, wesold it all to gain moneyto pay off our debt to the USA afterwards we supplied ourselves with the produce at the normal OPEC tares.
John.
Frank J Casella said:
Don Sutherland replied to Frank J Casella:
Frank J Casella replied to :
Tanja - Loughcrew said:
Don Sutherland said:
Utqiagvik (formerly Barrow) has seen a dramatic increase in the number of days each year where the temperature stays above freezing. Much of the increase has come recently, as summer Arctic sea ice has declined markedly from prior levels.
The change in the 30-year moving averages (to remove the noise of interannual variability) for the number of such days provides further illustration of the dramatic warming that is underway in the Arctic region.
From the 1921-50 base period through the 1951-80 base period, the average number of days with minimum temperatures above freezing was relatively stable. The lowest 30-year average was 39.4 days. The highest 30-year average was 43.4 days. The mean figure was 41.7 days.
For the 1961-90 base period, the 30-year moving average was 43.9 days. For the latest 30-year period (1989-2018), the moving average has increased to 63.4 days. That's a nearly 20-day increase over a remarkably short period of time. Through September 3, Utqiagvik has had 76 days with temperatures above freezing. The last time Utqiagvik had fewer than 50 days above freezing was 2003.
In 2007, the minimum Arctic sea ice extent fell below 5 million square kilometers for the first time (JAXA data set). Since then, only 2009 has had a minimum extent of 5 million square kilometers (5.054 million square kilometers). As of September 3, Arctic sea ice extent was 4.175 million square kilometers. During the "low ice" era that commenced in 2007, Utquiavik has averaged 76.8 days per year (2007-18) with above freezing temperatures.
Since 1979, satellite data for Arctic sea ice extent has been available (JAXA data set). As 30-year moving averages would result in an insufficient sample size of cases, 10-year moving averages were used to illustrate the link between Utqiagvik's increasing number of days with temperatures above freezing and declining Arctic sea ice extent. The 10-year moving average of such days increased by 12.1 for every 1 million square kilometer decline in average July-September Arctic sea ice extent (10-year moving average). The coefficient of determination was 0.93, which illustrates a very strong correlation.
Through September 3, Utqiagvik had a record 70 consecutive days where the temperature has stayed above freezing. The old record was 68 consecutive days from July 1-September 6, 2009. Prior to 2009, there were no cases with 60 or more consecutive days above freezing.
William Sutherland replied to Don Sutherland:
Pat Del said:
Don Sutherland replied to Pat Del:
Don Sutherland replied to :
Frank J Casella said:
www.heartland.org/news-opinion/news/climate-alarmists-foiled-no-us-warming-since-2005
Note: In doing my learning about this or any subject, as usual, I seek to debunk before I accept.
Don Sutherland replied to Frank J Casella:
1. The Heartland Institute is not a scientific institution. It conducts no scientific research. It submits no work to any of the scientific journals.
It is a public policy institute or think tank. Its mission statement declares, "The Heartland Institute is one of the world’s leading free-market think tanks. It is a national nonprofit research and education organization based in Arlington Heights, Illinois. Its mission is to discover, develop, and promote free-market solutions to social and economic problems."
2. The U.S. CRN does, in fact, show a warming trend if one takes the annual temperatures. Indeed, one of the CRN sites is Utqiagvik (Barrow) for which I provided information (graph + some underlying information) above. Speaking of Utqiagvik, today is on course to be that city's 50th day with a low temperature of 40°F (4.4°C) or above. The prior record was 32 days in 1998. One can find the data for each site here:
ftp.ncdc.noaa.gov/pub/data/uscrn/products/monthly01
The 8th column is the mean temperature for each location.
3. From outside the science, one might assume that the raw data is sufficient to reach conclusions. Actually, that's not always the case. Raw data might need to be adjusted for sound scientific reasons. One big issue is time of observation bias.
Statistical adjustments deal with historical changes in observation times that have been made at reporting stations during the course of their operation. Even if it might not seem like a big deal, moving the observation time backward or forward by even a few minutes can skew outcomes if one is dealing strictly with unadjusted or raw data. Therefore, one needs to use a standardized approach--which makes statistical adjustment necessary--so that one is truly comparing "apples to apples", not "apples to oranges" so to speak.
4. The Heartland claim concerning temperature "adjustments" falls apart when exposed to empirical evidence (which isn't surprising since it is not a scientific institution). Indeed, when the sites are compared with the CRN network one finds that the adjustments lead to improved accuracy. Here's the relevant paper concerning that matter:
agupubs.onlinelibrary.wiley.com/doi/full/10.1002/2015GL067640
The paper concludes:
During the period of overlap between the USHCN and USCRN networks, we can confidently conclude that the adjustments to the USHCN station records made them more similar to proximate homogenous USCRN station records, both in terms of trends and anomalies. There are no systematic trend biases introduced by adjustments during this period; if anything adjusted USHCN stations still underestimate maximum (and mean) temperature trends relative to USCRN stations.